Kubernetes Default Scheduling
The orchestration capabilities of Kubernetes when it graced the enterprise back in 2014 were truly remarkable for the evolution of distributed systems. The early days of Google’s Omega and Borg projects spawned this concept of task scheduling (to cells) that offered users various levels of Quality of Service (QoS) to fulfil service level objectives (SLOs).
These concepts formed the base of the lasting successor to those projects, Kubernetes, where a pod’s Request value assigned to the workload by the developer, is ultimately what gets fed into the default scheduler’s two step operation of filtering and scoring.
This designation from the user to a Kubernetes cluster however, presents a number of issues, all of which lead to an overall low-utilization of the cluster:
- It’s difficult (particular in beta releases) to ascertain an accurate resource usage for any given application, and thus any app owner is more likely to be conservative in their estimate
- Considering all the 3 QoS Classes available: Guaranteed, Burstable and Best-Effort - in a mission-critical Production environment, the tendency for developers is almost always to assign a QoS of Guaranteed (i.e. Request = Limits), promoting this mentality of ‘high-balling’ the Request
- Default scheduling out-of-the-box doesn’t consider any live (Prometheus) data to determine a node’s real time node utilization (or any other scraped metrics that could be fed as input)
By introducing a new scheduling mechanism, we’re looking to rectify the inefficiency of Kubernetes' standard scheduling. It’s a worthy cause and really should be at the top of any platform owner’s list when we consider any cost optimization/recovery activities across our clusters.
Secondary Scheduler Operator
OpenShift allows us to customize how workloads are scheduled via the Secondary Scheduler Operator. Through this BYO Scheduler paradigm, we can leverage a secondary scheduler to manage the workloads of our choice, whilst leaving the control plane components untouched, continuing to use the default scheduler shipped with OpenShift.
We have a host of alternative scheduler plugins at our disposal based on the scheduler framework.
Keeping in mind the problem statement above of nodes being under-utilized, it’d be wise of us to employ a scheduler plugin that seeks to pack nodes more efficiently. Certainly there are pitfalls to just considering CPU Utilization of the node outlined in this Red Hat blog here, but as an introduction to secondary scheduling let us take the basic goal of maintaining node utilization at a certain level and consider the Trimaran plugin.
Of the two scheduler strategies under Trimaran, TargetLoadPacking and LoadVariationRiskBalancing - the plugin uses a load watcher that retrieves five-minute history metrics (from metric providers like Prometheus) and caches the results and feeds those inputs into the Trimaran scheduling algorithm, all in all allowing us to bridge this gap between the allocated resources (requests) to what’s really happening on the node (real-time utilization).
TargetLoadPacking Plugin
Let’s take a look under the hood of the plugin’s algorithm and the end result of a scheduled pod.
Suppose we have the following output that indicates the current CPU utilization. Memory here has been omitted to simplify the demonstration.
$ oc adm top node -l node-role.kubernetes.io/worker=""
NAME       CPU(cores)    CPU%
worker-1   2000m         25%
worker-2   4000m         50%
worker-3   800m          10%
Here we have three worker nodes, with 8 cores each and utilization at 2, 4 and 0.8 cores, respectively (together with the value expressed as a %)
Plugin Algorithm
- Determine the utilization of the current node. We’ll call this ‘A’.
- Calculate the current pod’s total CPU requests and overhead. We’ll call this ‘B’.
- Add A and B together to get the expected utilization (U).
In our example, again for simplicity let us assume our pod(s) to be scheduled has 0 CPU requests and overhead.
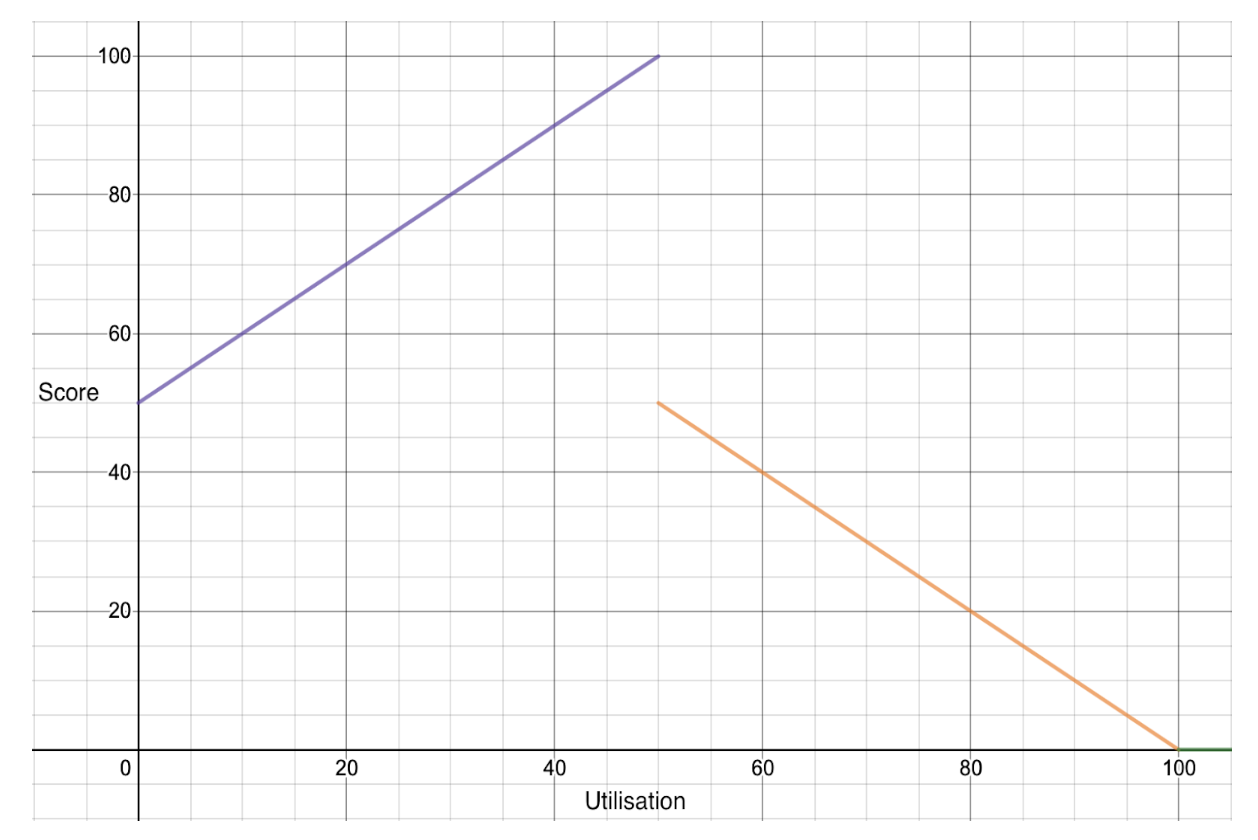
Encapsulating the algorithm into pseudocode, our goal is to output a Score for each node.
IF U <= X%
  score = (100 - X)U/X + X
ELSE IF X% < U <= 100%
  score = X(100 - U)/(100 - X)
ELSE IF U > 100%
  score = 0
Let us make the target utilization (X) equal to 40%. We can take actual utilization of the nodes from the output of oc adm top nodes above.
Calculating the score of each node in that case:
worker-1 → (100 - 40)*25/40 + 40 = 77.5
worker-2 → 40 * (100 - 50)/(100 - 40) = 33.3
worker-3 → (100 - 40)*10/40 + 40 = 55
Observing the piecewise function as a plot captured from the plugin’s README, we can see that the nodes are favored and penalized linearly as they reach and surpass the target utilization, respectively (in this README, target utilization is set to 50%).
Secondary Scheduler in action
Hopefully by now, we have enough insight into the mechanics of our chosen profile and we can now go ahead and install the Secondary Operator on our OpenShift cluster and see this load-aware scheduling in action.
Step 1: Create the namespace and install from Operator Hub
Let us create openshift-secondary-scheduler-operator namespace.
$ oc create ns openshift-secondary-scheduler-operator
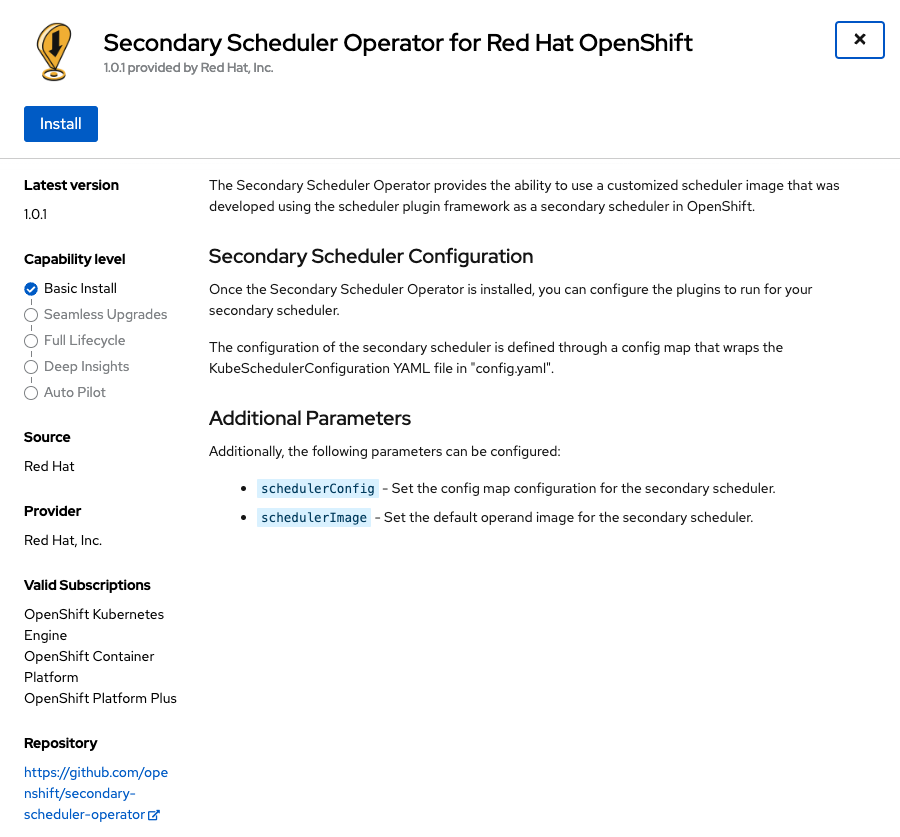
Step 2: Install from Operator Hub
Proceed to the console’s sidebar, Operators -> OperatorHub, search for Secondary Scheduler Operator and install the operator.
Step 3: Create an instance of SecondaryScheduler
Create a ConfigMap secondary-scheduler-config for the Trimaran KubeSchedulerConfiguration under the openshift-secondary-scheduler-operator namespace.
$ cat <<EOF > config.yaml
apiVersion: kubescheduler.config.k8s.io/v1beta1
kind: KubeSchedulerConfiguration
leaderElection:
  leaderElect: false
profiles:
  - schedulerName: secondary-scheduler
    plugins:
      score:
        disabled:
          - name: NodeResourcesBalancedAllocation
          - name: NodeResourcesLeastAllocated
        enabled:
          - name: TargetLoadPacking
    pluginConfig:
      - name: TargetLoadPacking
        args:
          defaultRequests:
            cpu: "1000m"
          defaultRequestsMultiplier: "1"
          targetUtilization: 40
          metricProvider:
            type: Prometheus
            address: ${PROM_URL}
            token: ${PROM_TOKEN}
EOF
For descriptions of the TargetLoadPacking plugin arguments refer to this README.
Export to shell, a series of Prometheus specific variables required by the ConfigMap, before generating the ConfigMap
export PROM_HOST=`oc get routes prometheus-k8s -n openshift-monitoring -o json |jq ".status.ingress"|jq ".[0].host"|sed 's/"//g'` && \
PROM_URL="https://${PROM_HOST}" && \
TOKEN_NAME=`oc get secret -n openshift-monitoring|awk '{print $1}'|grep prometheus-k8s-token -m 1` && \
PROM_TOKEN=`oc describe secret $TOKEN_NAME -n openshift-monitoring|grep "token:"|cut -d: -f2|sed 's/^ *//g'`
$ oc create -n openshift-secondary-scheduler-operator configmap secondary-scheduler-config --from-file=config.yaml
Step 4: Deploy the Trimaran Scheduler
And then from here, all we need to do is point the schedulerConfig to our secondary-scheduler-config ConfigMap when creating our SecondaryScheduler CR (leaving defaults for the remainder). We can do this via the console or alternatively via the below:
$ cat <<EOF | oc apply -f -
kind: SecondaryScheduler
apiVersion: operator.openshift.io/v1
metadata:
  name: cluster
  namespace: openshift-secondary-scheduler-operator
spec:
  managementState: Managed
  schedulerConfig: secondary-scheduler-config
  schedulerImage: k8s.gcr.io/scheduler-plugins/kube-scheduler:v0.22.6
EOF
Step 5: Observe the current load
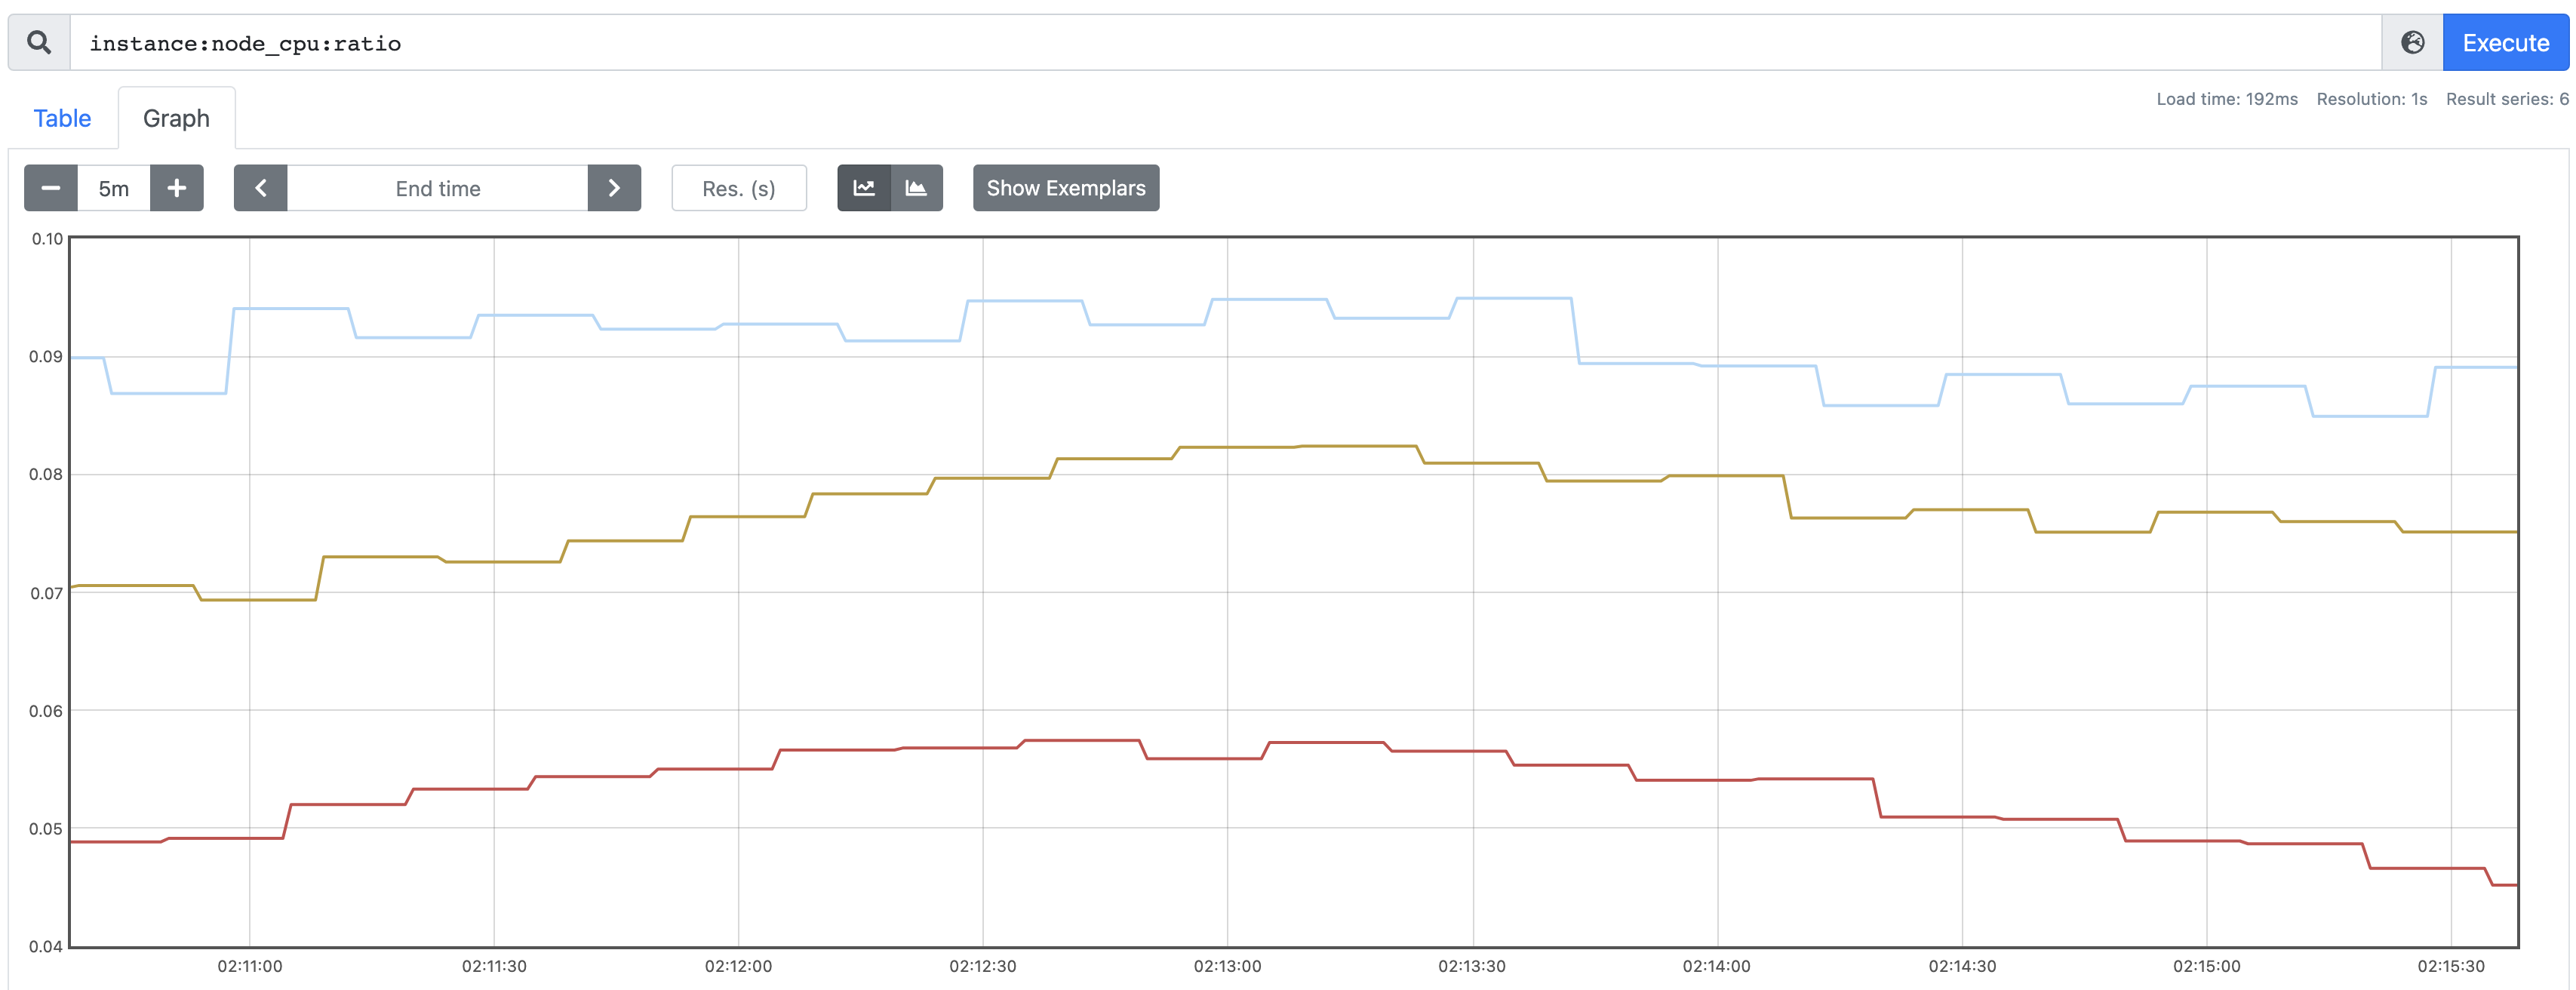
Before we create a workload that is targeted by our secondary scheduler, let us observe the load on the worker nodes with respect to the Prometheus metric that the TargetLoadPacking plugin employs. Trimaran plugins are actually using a library called load-watcher, which uses the following metric endpoints for CPU.
It should be noted that the Prometheus recording rule for CPU used in the load watcher’s code, instance:node_cpu:ratio is no longer available in OpenShift 4.10. This demo made use of a 4.8 cluster with a 4.10 Red Hat Operator index image to install the Secondary Scheduler Operator from Operator Hub. More details on how to do that here.
We can see that all are sitting below the target utilization of 40%, so with that knowledge we know that the scheduler is going to ‘pack’ those with the highest CPU utilization, under the condition that they are below the target utilization. Based on this in our case, we should assume that our single-replica pod should go to the worker node 2, i.e. the light blue line.
Step 6: Deploy the test Pod
Let’s create a Pod (in the openshift-secondary-scheduler-operator namespace is fine) that designates our secondary scheduler for allocation.
$ cat <<EOF | oc apply -f -
apiVersion: v1
kind: Pod
metadata:
  name: custom-scheduler-example
  namespace: default
  labels:
    name: custom-scheduler-example
spec:
  schedulerName: secondary-scheduler
  containers:
  - name: pod-with-second-annotation-container
    image: docker.io/ocpqe/hello-pod
EOF
Now, we can run an oc describe and observe where the pod ended up.
$ oc describe pod custom-scheduler-example | grep Scheduled
  PodScheduled      True
  Normal  Scheduled       29s   secondary-scheduler  Successfully assigned openshift-secondary-scheduler-operator/custom-scheduler-example to worker-2
Additionally, we have this output from the secondary-scheduler-* pod logs in the openshift-secondary-scheduler-operator namespace:
I0117 07:55:29.373575 1 scheduler.go:675] "Successfully bound pod to node" pod="default/custom-scheduler-example" node="worker-2" evaluatedNodes=6 feasibleNodes=3
Beautiful, as expected 🎉
Summary
Unfortunately the pain of a forever-increasing cluster is one felt by many customers I interface with (as well as myself!). At its core, the default scheduler shipped with Kubernetes assumes that everyone will be a good global citizen and accurately estimate the footprint of their workload. What’s more, and to make matters worse, overcommitment of resources is actually rewarded if we consider two applications scheduled on the same node, the larger provisioned workload will win out when the node gets ‘busy’.
The net result of all this is an extremely low utilization of computing resources most of the time, equating to a severe ballooning of infrastructure costs. The latter can really be quantified and I think for most they’d be horrified to be told of the resource wastage as a dollar value. So as I mentioned in the intro, if your Kubernetes cluster expenses and overhead are raising eyebrows in your organization, trialing and experimenting with a secondary scheduler could be the best thing you’ll ever do for your balance sheet!
comments powered by Disqus